The P/E Ratio Explained: What It Measures and Where It Misleads
Price divided by earnings is the most quoted valuation number in markets. It is also easy to misread, because both halves of the fraction can be manipulated or distorted.
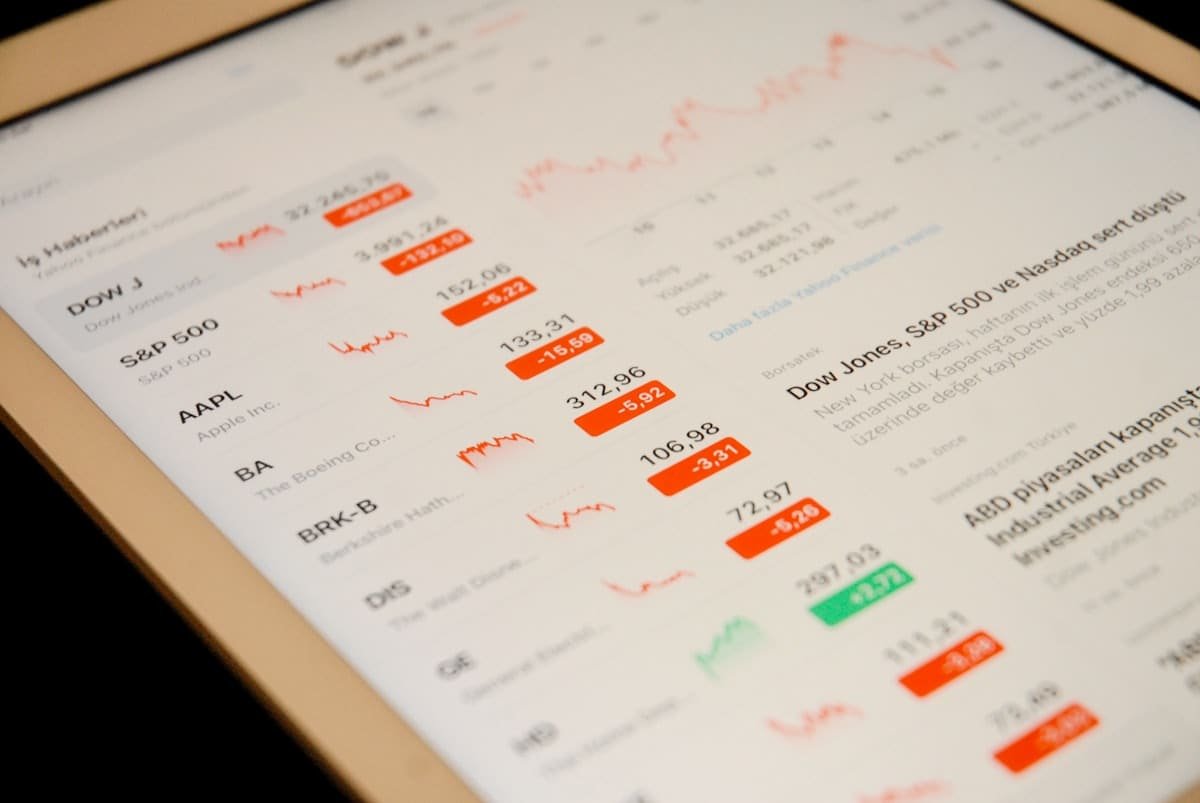
The price-to-earnings ratio is the most quoted number in equity markets and one of the easiest to misuse. Its simplicity is the problem: two numbers, one division, and a great deal hiding inside both.
The calculation
P/E = Share price / Earnings per share
A company trading at 40 with earnings of 2 per share has a P/E of 20.
The usual interpretation is that you are paying twenty years of current earnings for the shares. That is loose but useful, provided you remember the crucial assumption: it treats current earnings as if they will continue unchanged forever. They will not.
What a P/E is really telling you
A P/E is not a measure of value. It is a measure of expectation.
- A high P/E means the market expects earnings to grow, and is paying in advance for that growth.
- A low P/E means the market expects earnings to stay flat or fall.
This reframing matters because it flips the intuition most people start with. A low number is not automatically cheap — it is the market telling you something it believes about the future.
The value trap
Consider a company earning 2 per share, trading at 40, so a P/E of 20.
Its main product is being displaced by a competitor. Earnings are expected to halve next year. The share price falls to 20 in anticipation.
Its P/E is now 10 — apparently half as expensive. But if earnings do drop to 1 per share, the forward-looking P/E is still 20. Nothing became cheaper. The price simply moved to reflect what is coming.
This is why screens sorted by lowest P/E are largely lists of companies the market expects to deteriorate. Some are genuinely mispriced. Most are cheap for a reason that has not reached the accounts yet.
The question to ask of every low P/E is not "is this a bargain" but "what does the market know or believe that I have not accounted for".
Trailing versus forward
| Trailing P/E | Forward P/E | |
|---|---|---|
| Earnings used | Last twelve months, reported | Next twelve months, estimated |
| Status | Audited fact | Analyst opinion |
| Reliability | High, but backward-looking | Depends entirely on the forecast |
Forward P/E is almost always the lower of the two, for a simple reason: analysts generally forecast growth. That makes any company look cheaper on forward numbers than trailing ones.
Analyst estimates also carry a documented optimistic bias, and they are revised downward more often than upward as a reporting date approaches. A forward P/E is a valuation built on a forecast that has a known direction of error.
Where the earnings number gets slippery
The denominator is not as solid as it looks.
Accounting choices. Depreciation schedules, revenue recognition and inventory methods all affect reported profit legitimately and materially.
One-off items. A large asset sale inflates a single year's earnings and collapses the P/E, making a company look cheap for reasons that will not repeat.
Adjusted earnings. Many companies report an "adjusted" figure alongside the statutory one, excluding items they consider unrepresentative. Sometimes that is reasonable. Sometimes it excludes real, recurring costs. Check which earnings figure a quoted P/E uses.
Negative earnings. A loss-making company has no meaningful P/E at all. The ratio simply does not apply, which is why fast-growing unprofitable companies are valued on other measures.
Sector context is not optional
Different industries sustain permanently different ranges, and the reasons are structural rather than sentimental:
- Utilities have stable, regulated, slow-growing earnings, and trade on low multiples.
- Software has high growth and low capital requirements, and trades on high ones.
- Banks are usually assessed on price-to-book as well, because assets matter more than a single year's profit.
- Cyclicals such as miners and carmakers show a perverse pattern: P/E looks lowest at the top of the cycle, when earnings are peaking and about to fall.
That last point catches people repeatedly. For a cyclical business, a low P/E is often a sell signal rather than a buy one.
Useful companions
P/E alone is thin. It becomes more informative alongside:
- PEG ratio — P/E divided by the earnings growth rate, which adjusts for how much growth you are actually getting.
- Price-to-book — useful for asset-heavy businesses and banks.
- Free cash flow yield — harder to manipulate than earnings, because cash is cash.
- Debt levels — two companies with identical P/Es and very different balance sheets are not comparable.
- The company's own history — how does today's multiple compare to its five-year range?
A workable process
- Note the P/E, and check whether it is trailing or forward.
- If forward, note that it rests on a forecast with a known optimistic bias.
- Compare against the company's own history, not the whole market.
- Compare against direct competitors, not other sectors.
- If it is unusually low, find out why before concluding anything.
- Cross-check with free cash flow, which is harder to dress up.
The bottom line
The P/E ratio compresses a company's entire outlook into one number, which makes it convenient and makes it lossy. Its most common misuse is treating a low reading as a bargain when it is usually a forecast.
Used properly it is a starting question rather than an answer: what is the market expecting here, and do I have a reason to disagree?
This article is educational and is not financial advice. The value of investments can fall as well as rise.
Frequently asked questions
What does the P/E ratio actually measure?+
How much you pay for each unit of a company's annual earnings. A P/E of 20 means paying 20 for every 1 of yearly profit, which can be read loosely as 20 years of current earnings to recoup the price. It is a measure of expectation as much as value: a high P/E means the market expects earnings to grow.
Is a low P/E ratio good?+
Not reliably. A low P/E means the market is paying little for current earnings, and the usual reason is that it expects those earnings to fall. Buying purely on a low P/E without asking why it is low is the classic value trap.
What is the difference between trailing and forward P/E?+
Trailing P/E uses the last twelve months of reported earnings, which are audited facts. Forward P/E uses analyst estimates for the coming year, which are opinions. Forward P/E is usually lower simply because analysts expect growth, and analyst forecasts have a documented optimistic bias.
Can P/E ratios be compared across industries?+
Only with care. Different sectors sustain permanently different P/E ranges because they have different growth rates, capital requirements and earnings stability. A utility and a software company with the same P/E are not equivalently priced.
Sources and further reading
Risk warning
Trading cryptocurrencies, forex and leveraged derivatives involves substantial risk of loss and is not suitable for every investor. Our content is journalism and education — never personalised financial advice. Full disclaimer.
Published by
Trading News GlobalTrading News Global is an independent publication. Our articles are researched, written and edited in-house against the standards set out in our editorial policy, and published under the newsroom byline rather than individual names. Responsibility for everything on this site sits with the publication, and every article carries a route to correct it.